网络图的可视化
官方文档:https://www.osgeo.cn/networkx/reference/classes/graph.html
networkx是Python的一个包,用于构建和操作复杂的图结构、动态和功能,提供分析图的算法。使用NetworkX,您可以以标准和非标准数据格式加载和存储网络,生成多种类型的随机和经典网络,分析网络结构,构建网络模型,设计新的网络算法,绘制网络,等等。
库
1
2
import networkx as nx
import matplotlib.pyplot as plt绘图
1
2
>names = {} # 人物出现次数
>relationships = {} # 关系字典1
2
3
4
5
6
7
8
9
10
11
12
13
14
15
16#绘图部分
G = nx.Graph()
for name, times in names.items():
if times>=3:
G.add_node(name)
for name, edges in relationships.items():
for v, w in edges.items():
if w > 3:
G.add_edge(name,v,weight=w)
pos = nx.shell_layout(G)
nx.draw_networkx_edges(G, pos, width=[float(d['weight']/10) for (u, v, d) in G.edges(data=True)])
nx.draw_networkx_nodes(G, pos)
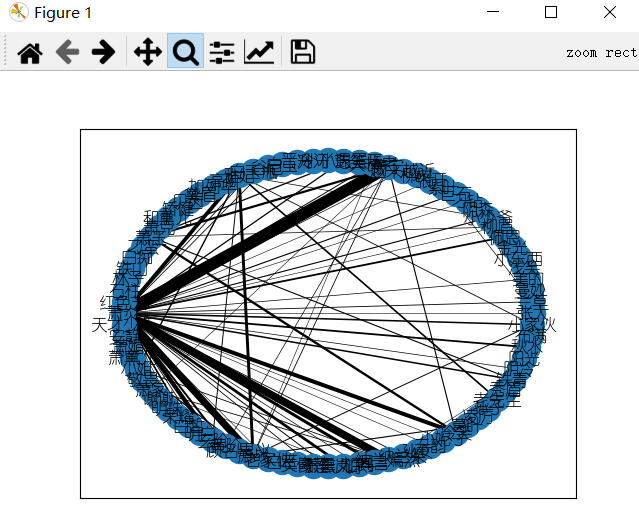
nx.draw_networkx_labels(G, pos, labels=None, font_size=12, font_color='k', font_family='YouYuan',font_weight='normal')
plt.show()效果: